
XRP price gained nearly 7% over the past seven days. That makes it the second-best performing top 10 cryptocurrency after Dogecoin during a period when most major assets remain muted.
But the otherwise bullish surface hides a battle brewing underneath between two opposing forces on different timeframes.
Sponsored
Sponsored
CMF Breakdown Sets Up Head and Shoulders Crash Risk
The 4-hour chart shows a head and shoulders pattern forming with the neckline near $1.44. This bearish reversal structure carries approximately 16% crash risk measured from the head’s peak to the neckline. XRP has been ranging since February 17, attempting to avoid the breakdown. The pattern itself looks complete and ready to activate if support fails.
Between February 15 and February 18, something dangerous appeared. XRP price trended higher from the lows, attempting recovery. During that exact same period, the Chaikin Money Flow indicator trended lower on the 4-hour chart. CMF measures the relationship between price and volume to determine if institutional money is flowing in or out of an asset. Readings above zero indicate accumulation. Readings below zero show distribution.
Want more token insights like this? Sign up for Editor Harsh Notariya’s Daily Crypto Newsletter here.
CMF broke below the zero line while the price bounced.
This divergence suggests institutions may be selling into strength. CMF is also approaching a breakdown of its own descending trendline connecting lower lows. If CMF breaks the downward trendline without an immediate recovery, it could confirm a breakdown of the head-and-shoulders pattern. The $1.44 neckline becomes the trigger level for the 16% measured move lower.
Sponsored
Sponsored
Exchange Outflow and Whale Buying Challenge the XRP Price Breakdown Threat
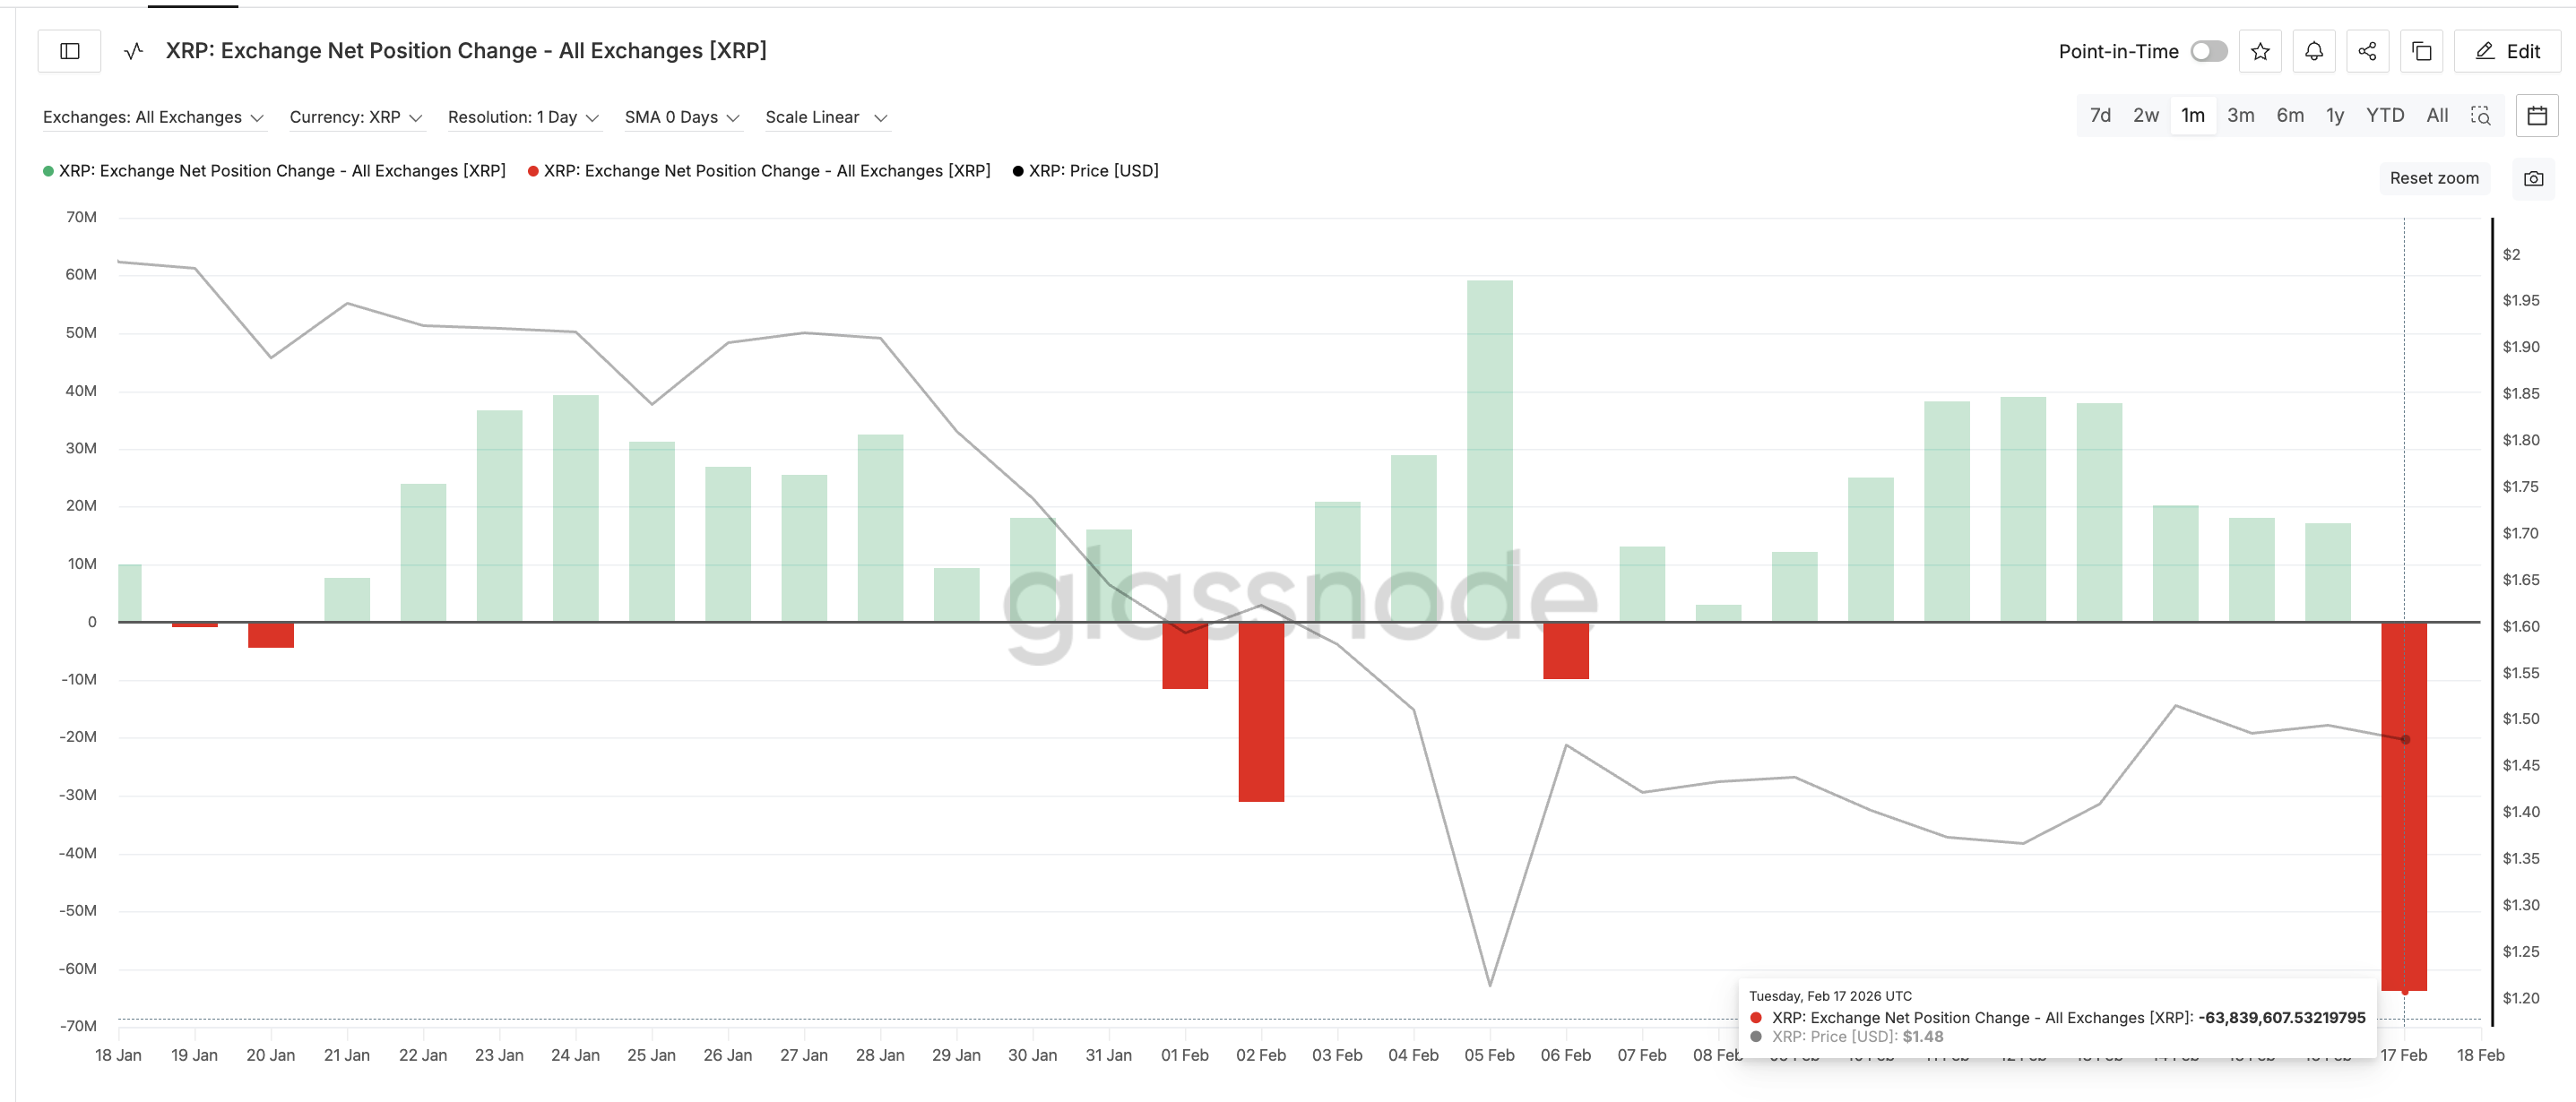
But something shifted dramatically on February 17. Exchange net position change measures the 30-day rolling change in supply held in exchange wallets. Between February 7 and February 16, this metric stayed positive. Positive readings mean coins are flowing into exchanges, creating sell pressure.
On February 17 the metric flipped violently negative to -63.84 million XRP. That represents a massive outflow from exchanges. This sudden reversal is 6.5 times larger than the last outflow recorded on February 6 at -9.82 million XRP. Someone aggressively removed coins from exchanges during the exact period when CMF broke down on the 4-hour chart.
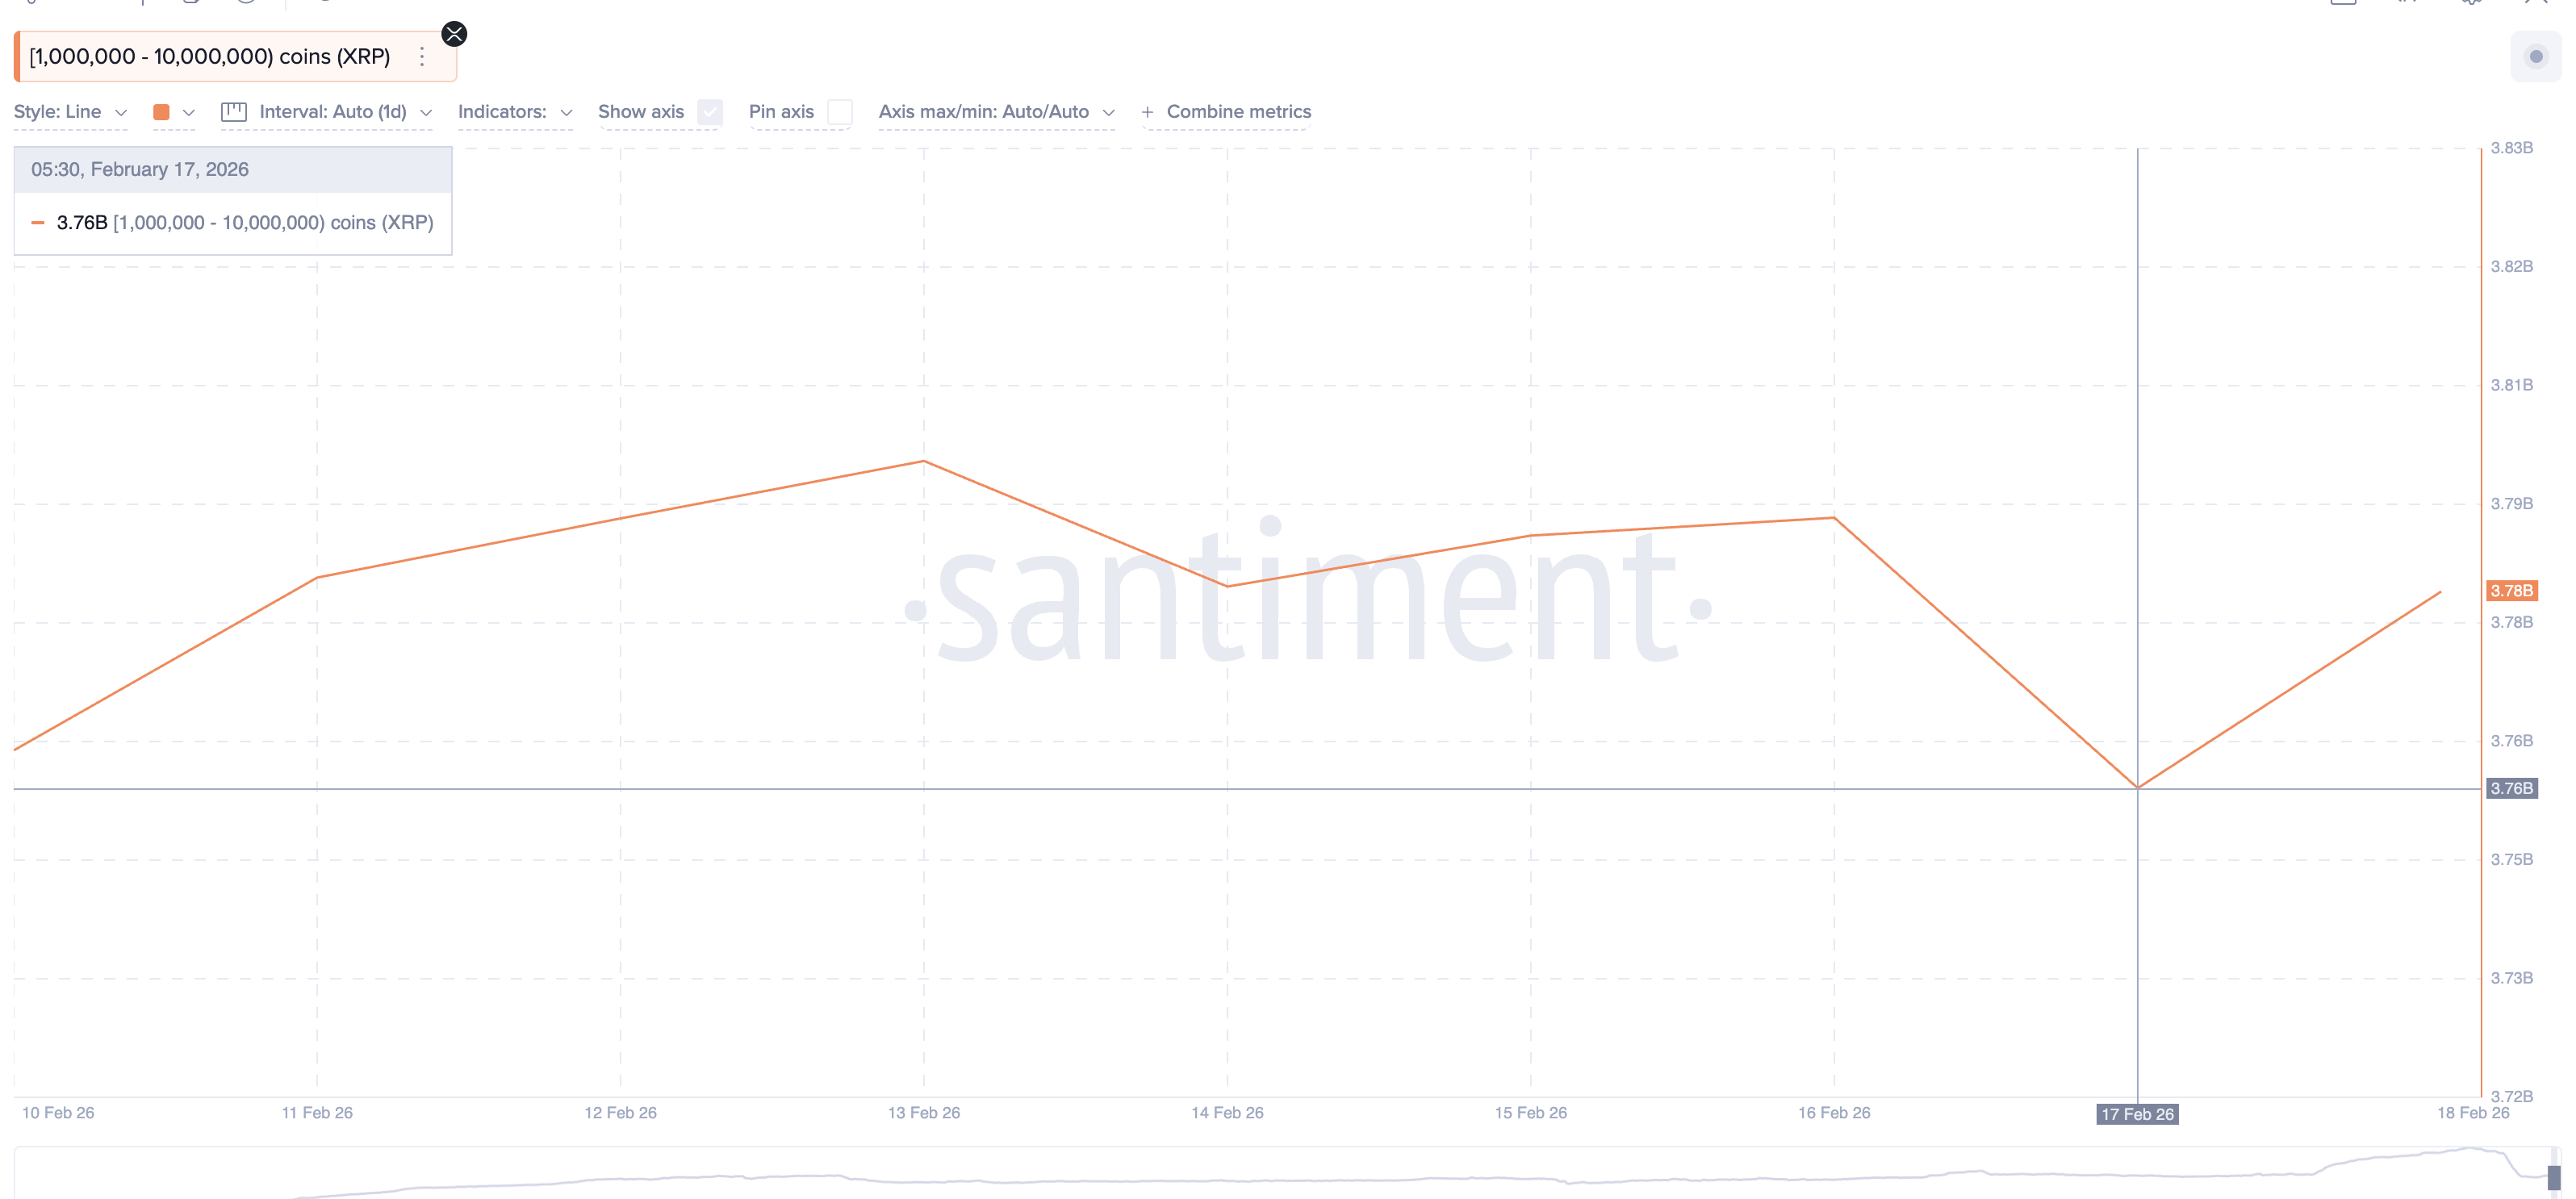
Smaller whale addresses holding between 1 million and 10 million XRP started accumulating on February 17. Their combined balances increased from 3.76 billion to 3.78 billion XRP. That is an addition of 20 million coins. These whales account for roughly 31% of the total exchange-specific change. The remaining could be smart money, retail investors, or other whale cohorts. Each metric has limitations, but the 20 million whale accumulation confirms this is not purely retail activity.
Sponsored
Sponsored
The timing creates a direct conflict. CMF on the 4-hour chart shows possible short-term institutional selling. Exchange outflows, followed by whale buying, show medium-term accumulation. Both cannot be right simultaneously unless different groups are acting on different timeframes with opposite convictions.
Smart Money Index Flashes Same Signal That Triggered 30% Rally
The daily chart resolved the conflict. The Smart Money Index crossed above its signal line on February 15. This indicator tracks positioning by experienced traders on longer timeframes.
Crossovers above the signal line generate buy signals. The last time this crossover occurred was January 1, 2026. XRP rallied over 30% following that signal.
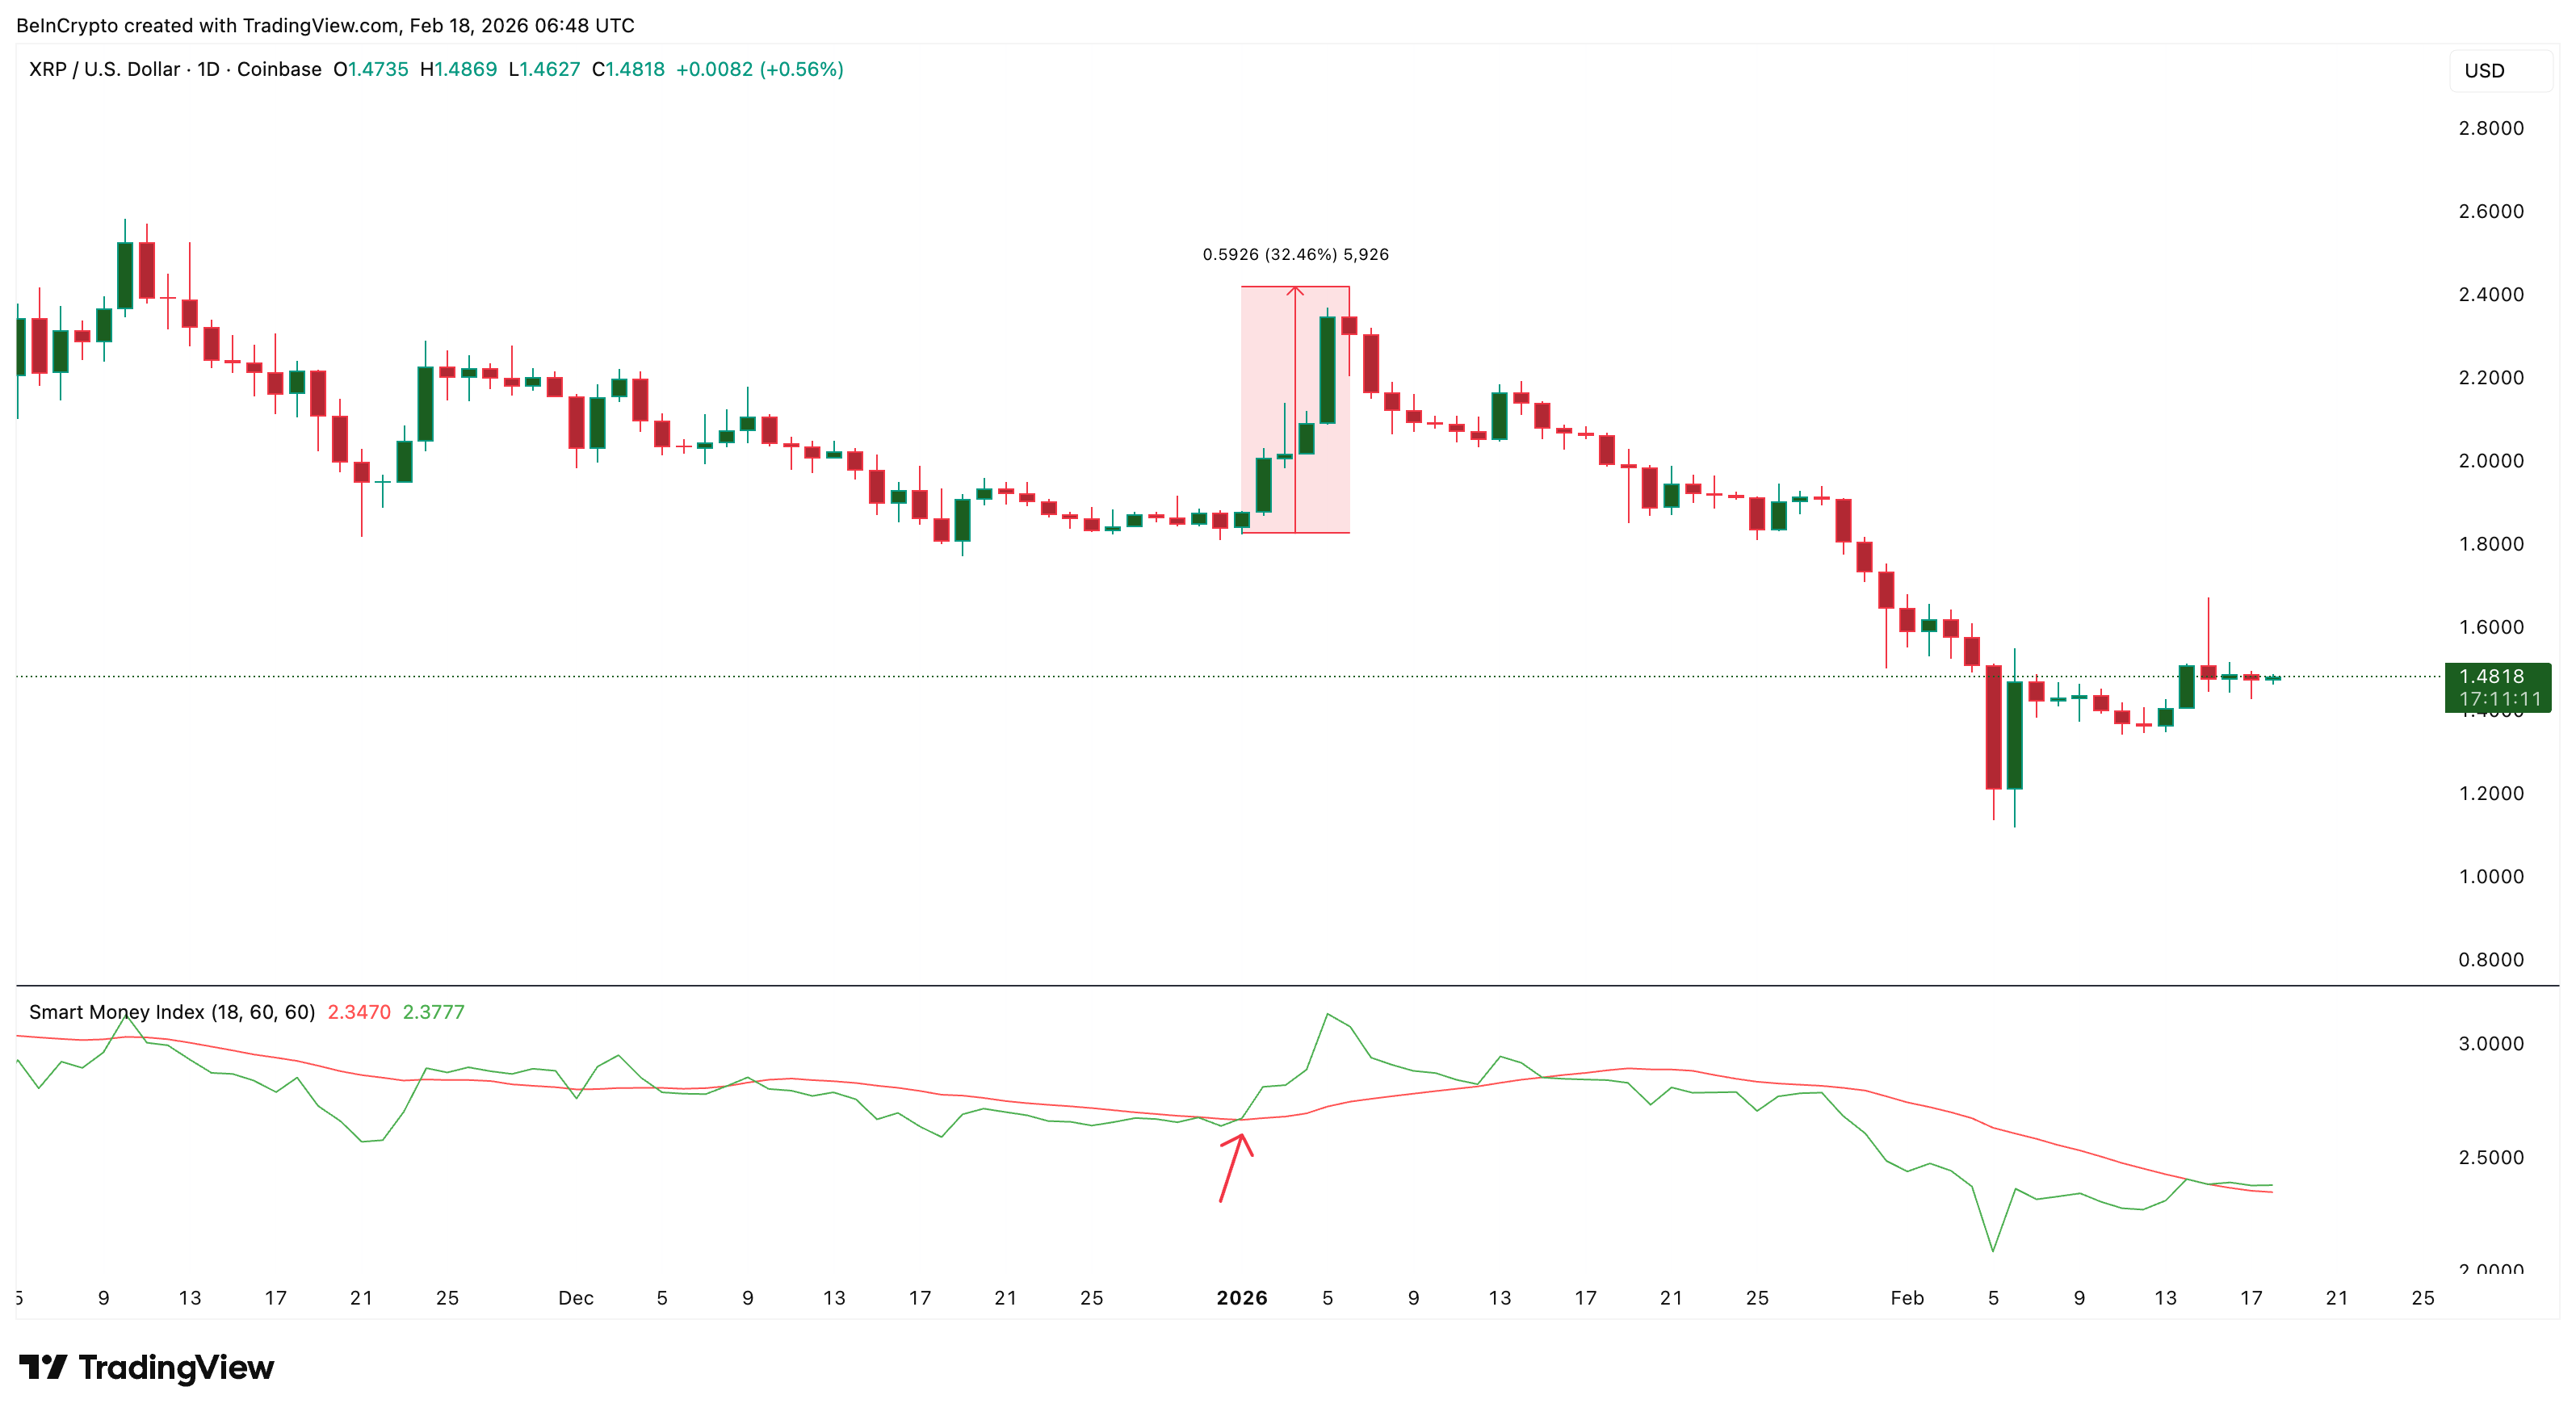
The current setup mirrors that exact pattern. Smart Money positioned on February 15. Whales started accumulating on February 17. Exchange outflows spiked on February 17. All three events align, showing coordinated positioning rather than random retail buying. The 4-hour CMF breakdown could now be representing short-term profit-taking or repositioning. The daily Smart Money signal represents medium-term bullish conviction.
Sponsored
Sponsored
Critical XRP Price Support Decides Crash or Rally?
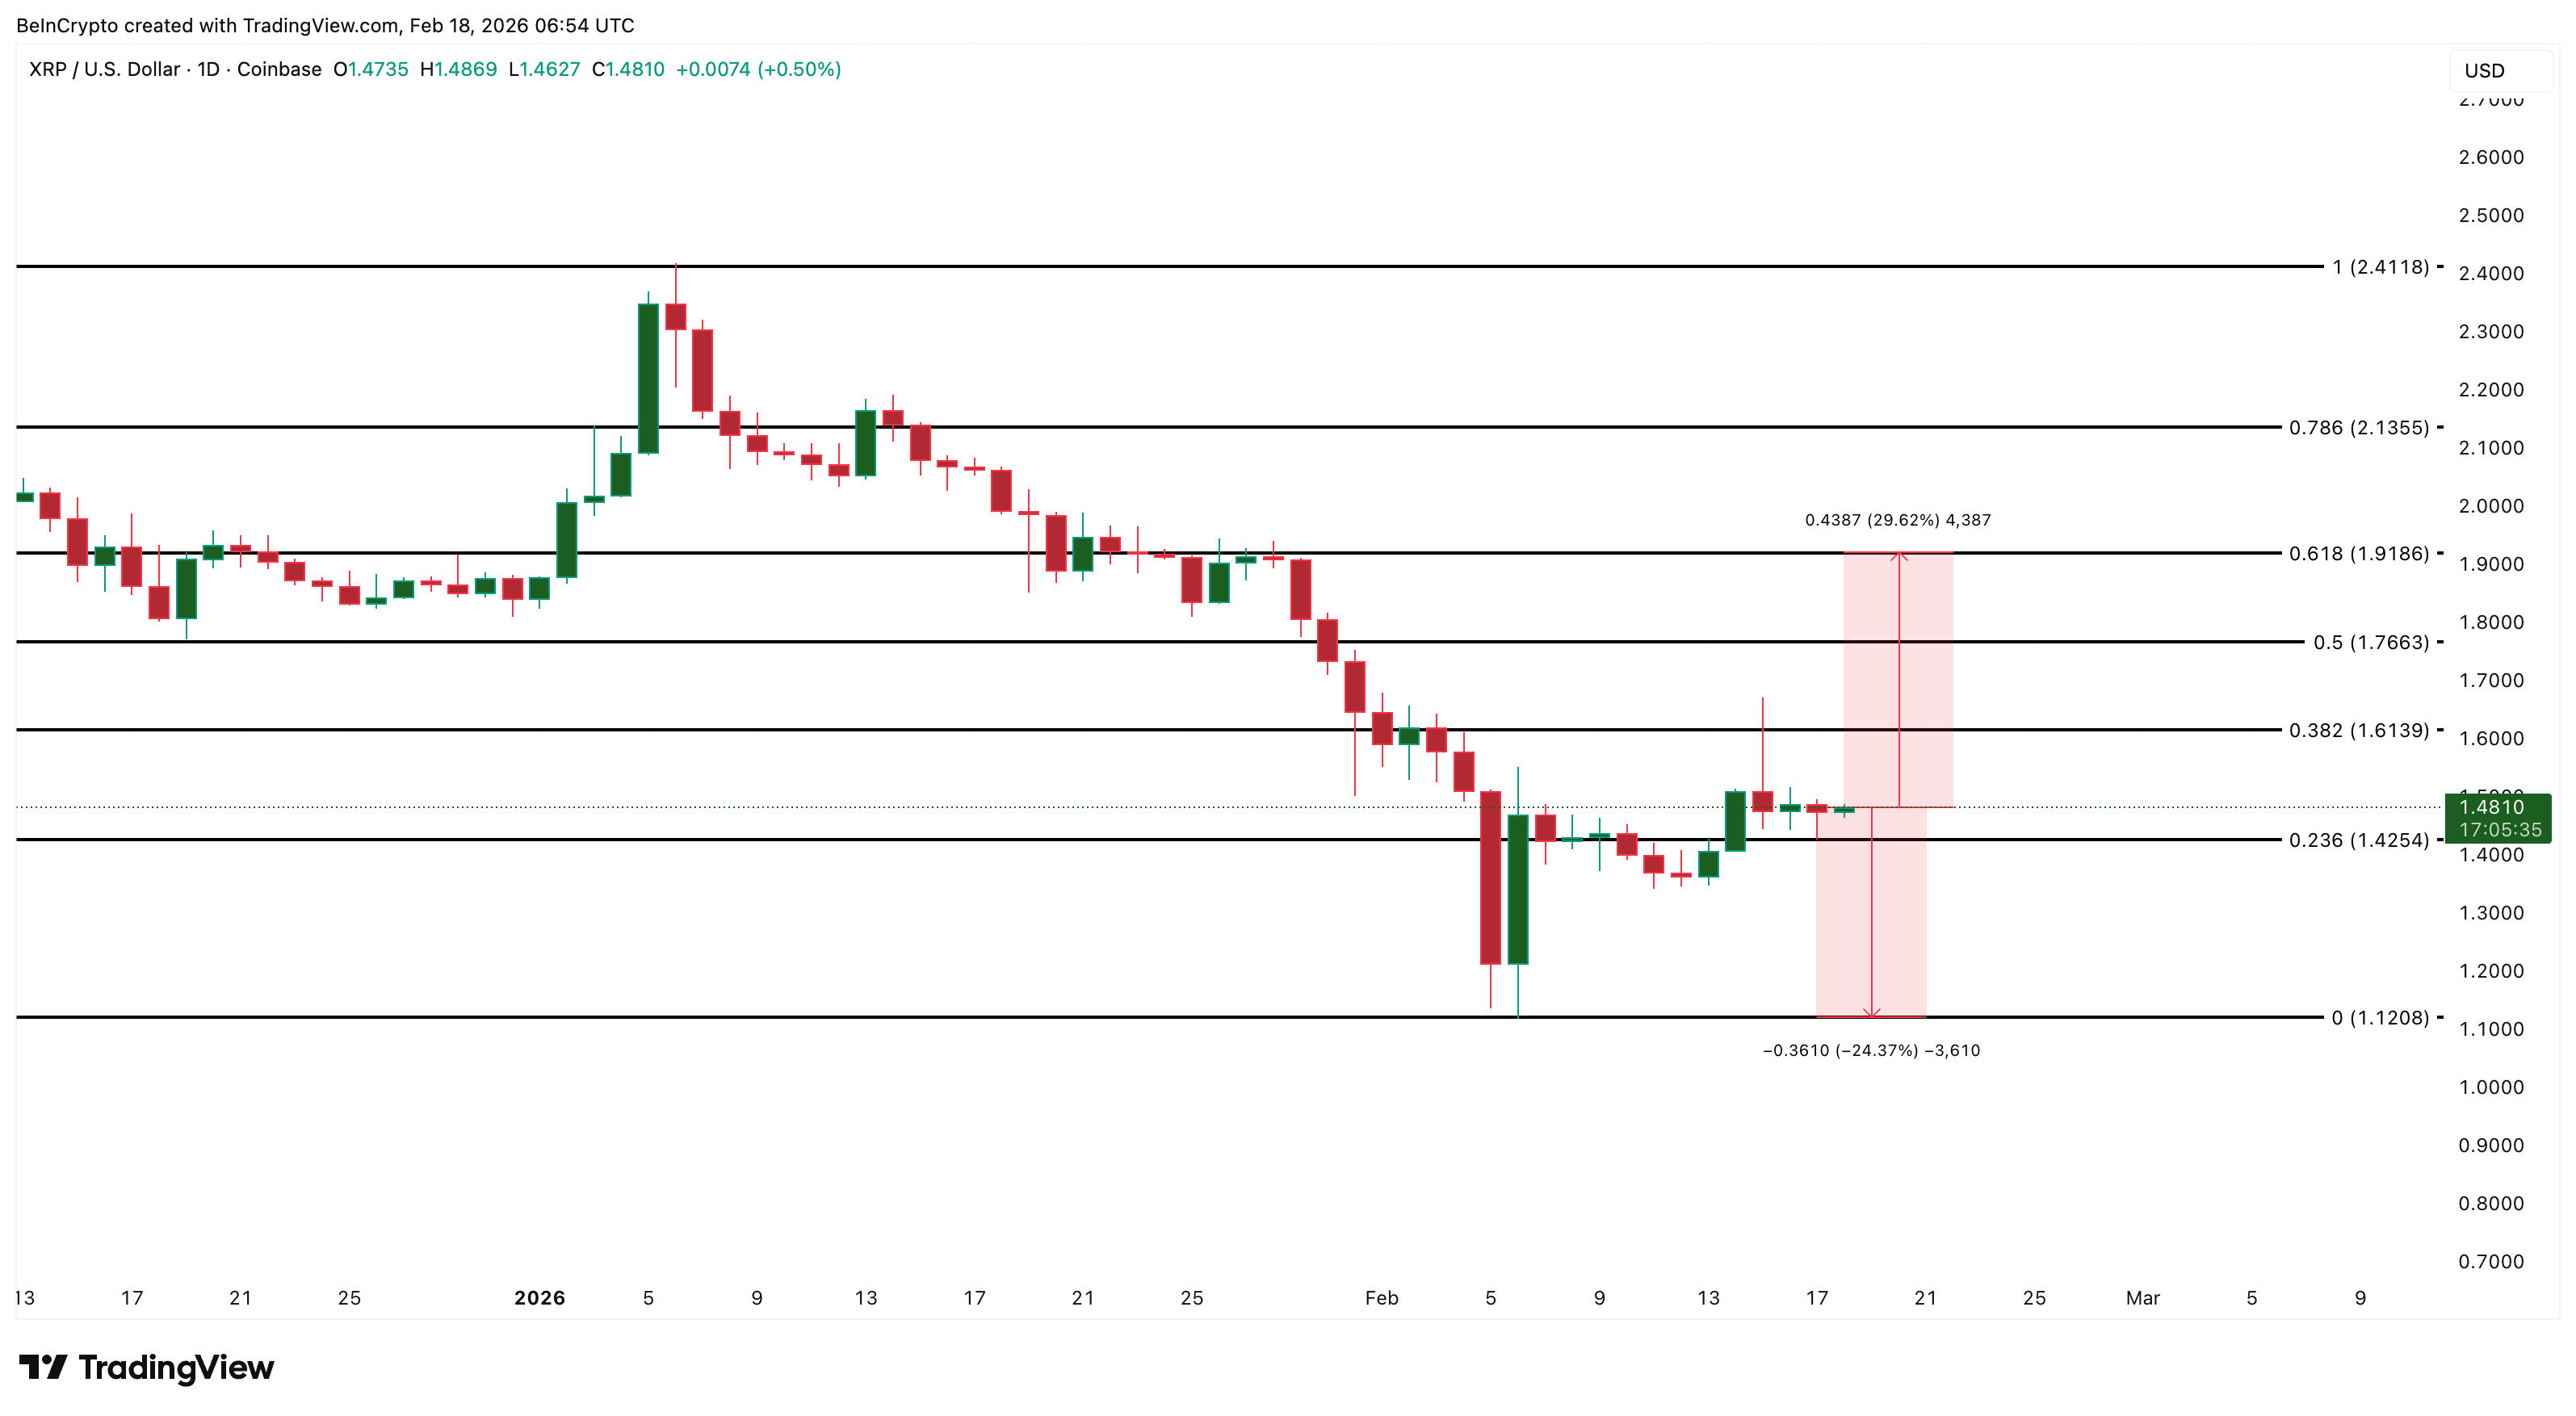
XRP price currently trades near $1.48, with the next key support at $1.42, per technical projections. Additionally, this level aligns closely with the $1.44 head and shoulders neckline, discussed earlier. If this support breaks the bearish pattern activates immediately. The measured move targets $1.12, which exceeds the initial 16% projection and represents severe technical damage.
If $1.42 holds and Smart Money positioning plays out like January, the first target sits at $1.91. That represents approximately 30% upside from current levels, closely matching the previous rally. Breaking above $1.91 could open the path toward $2.13, followed by $2.41 on continued momentum.
The conflict between timeframes creates the crossroads. While the Short-term technicals point down, the medium-term positioning points up. Whale accumulation of 20 million XRP and Smart Money precedent of a 30% rally favor the upside scenario. But XRP must hold $1.42 or the crash risk activates regardless of what daily signals suggest.